Back to Madhilaiya
FINANCIAL INTELLIGENCE · FORECASTING
Explain performance and forecast what changes next.
Connect plans, commitments and actual behaviour so management can see the drivers behind profit and liquidity.
ACTUAL DEMONSTRATION
Explore every screen in this workflow.
Each view is shown in full. Select any screen to inspect the original at its native size.
Open full size Synthetic demonstration data · illustrative analysis · not a claim of client results
THE FINANCE QUESTION
Why did performance move away from plan, and what does current behaviour imply for the outlook?
01 · CONNECT
Bring the relevant records into one traceable view.
BudgetActual ledgerOperational driversCommitmentsLatest reforecast
02 · RECONCILE AND EXPLAIN
Move from fragmented records to a controlled finding.
- 01Map plan to actuals
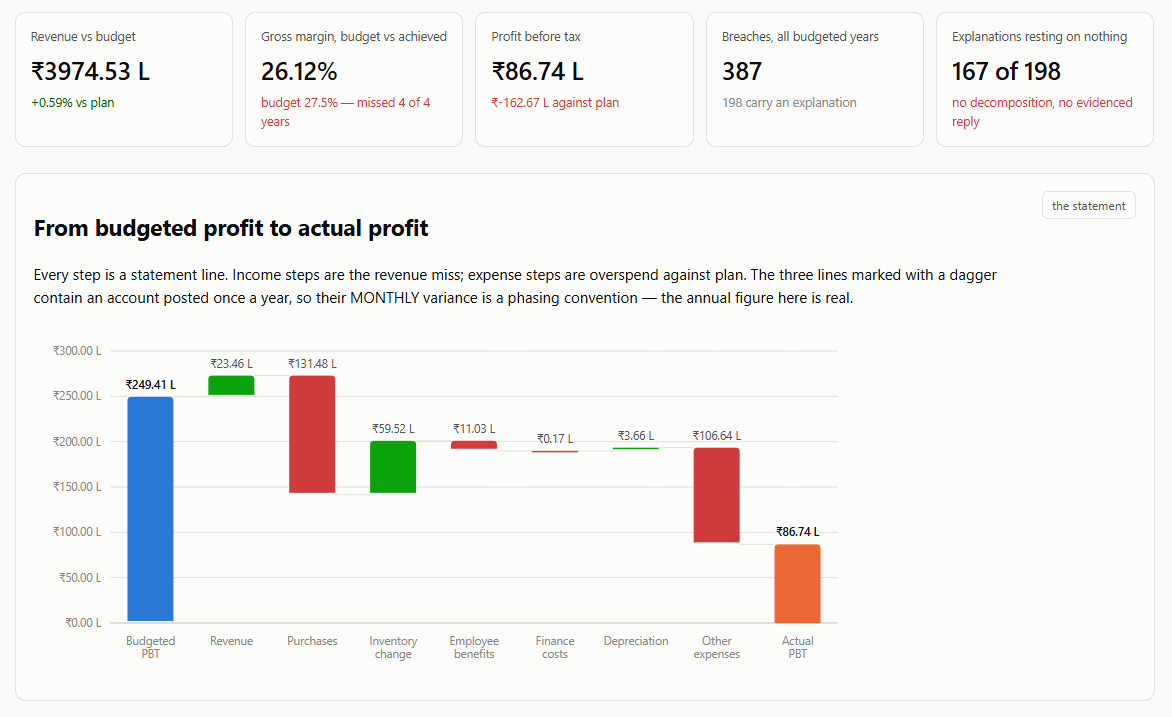
- 02Decompose the variance
- 03Refresh behavioural assumptions
- 04Model management action
03 · ACT
Give finance a prioritised starting point.
Finance retains judgment. These examples use synthetic data and illustrative assumptions. Findings require validation against the client's records, controls and requirements before action.
ONE FINANCE PROBLEM · EVIDENCE TO ACTION